Home › Admin & Manager Guides › Analytics Boards
Analytics Boards
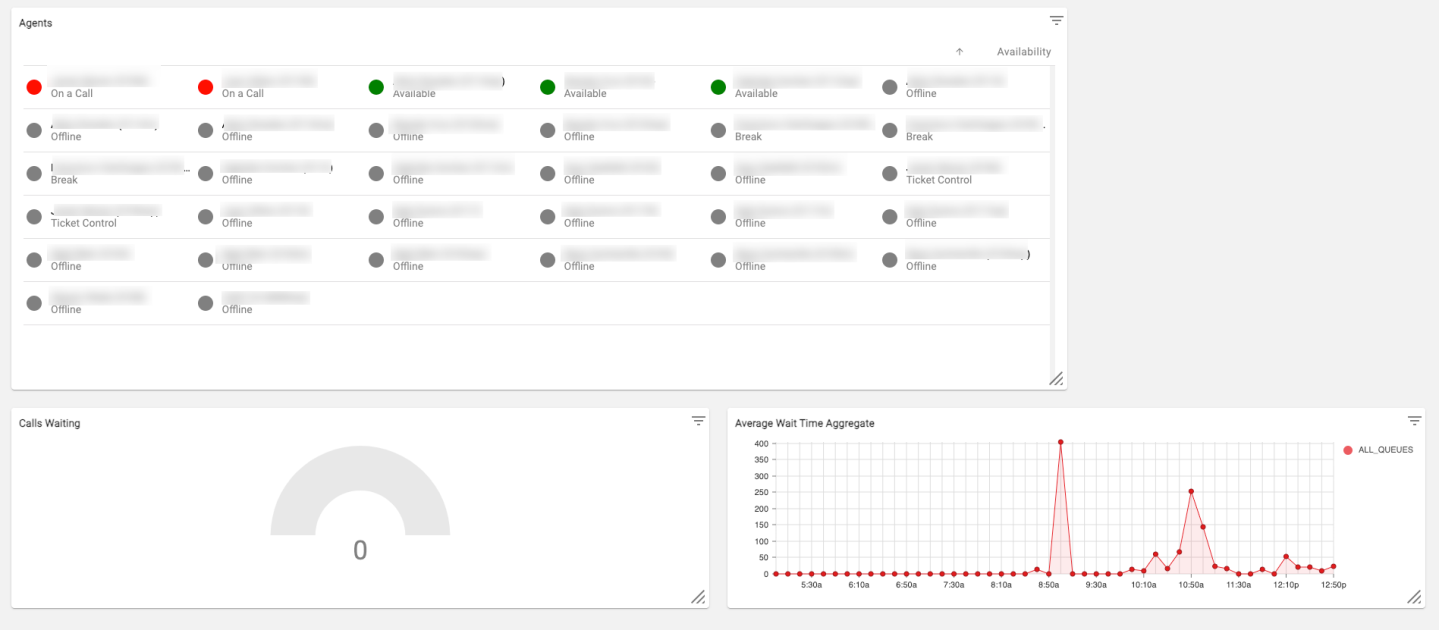
Analytics lets Office Managers and Call Center Supervisors put real-time queue statistics on a TV, monitor or PC in the call center. Boards hold "cards" that display exactly the data you care about.
How to Access Analytics
- Log in to the Portal as an Office Manager or Call Center Supervisor.
- Select Call Center at the top of the page.
- Select Analytics — it opens in a new browser tab. Any boards you've already created appear here.
How to Create a Board
- Select ADD A BOARD (or the "hamburger" menu in the upper left → New Board).
- Name the board at the top of the page and select Save.
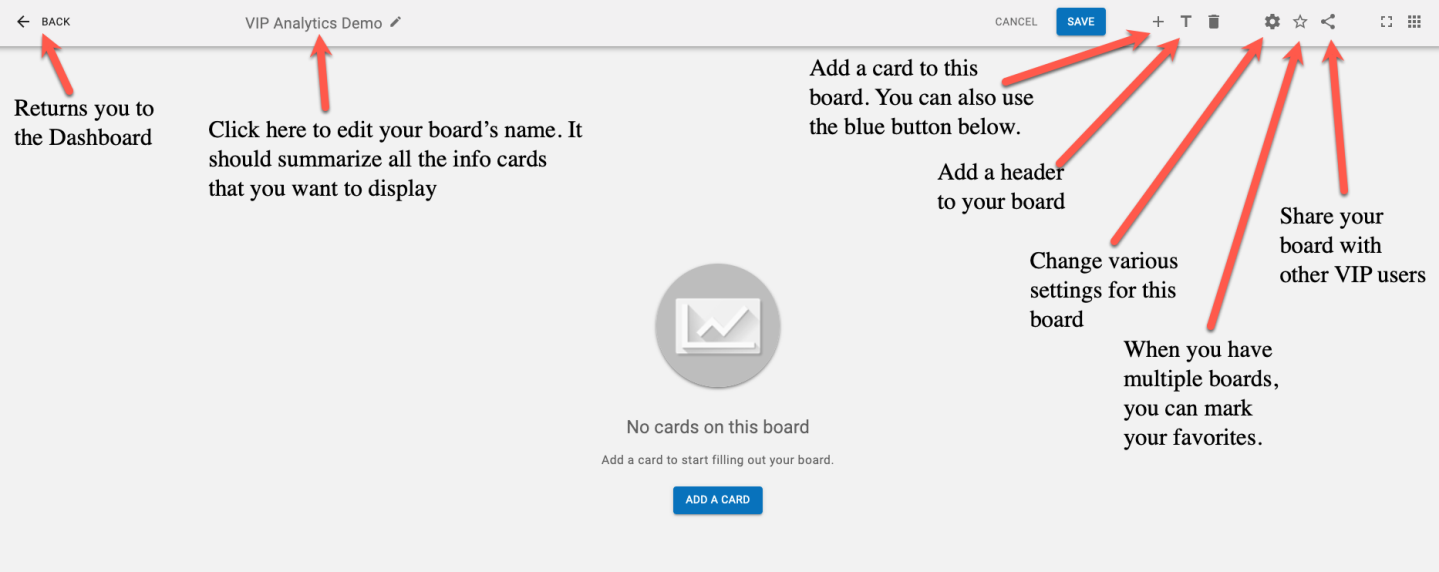
- Each board has its own toolbar at the top.
How to Add a Card to Your Board
- Select ADD A CARD — an empty card appears.
- Select CHOOSE TYPE to pick how the data is displayed:
- Line Chart — great for trends.
- Gauge — for rapidly changing data.
- Single Stat — one number; useful for benchmarks and thresholds.
- Table — multiple rows of data.
- Grid — data in a matrix.
- Note — a miscellaneous note for your audience.
- Iframe — embed data from other websites.
- Select NEXT, then + ADD DATA and choose the metric to display in real time (e.g. Calls Waiting).
- To track a specific queue, use the Filter drop-down and pick the queue.
- Adjust the Gauge upper limit to fit your scale.
- Want an alert when levels hit a threshold? Select Add Alert, choose the threshold and color, then Add.
- Select Next for the STYLE section — fonts, aesthetics and other options — then DONE to place the card.
Repeat to add more cards, and drag to rearrange them. Boards can run on TVs and monitors around your call center or on your own screen.
ℹ Note: when you create or edit a card, it may take up to a minute for data to appear.